Experiment 22
The blog post introduces CoBAD (Collective Behavior Anomaly Detection), a deep learning approach that detects anomalous group behaviors in human mobility data by analyzing stay points and collective patterns rather than individual trajectories.
Introduction: Beyond Individual Anomalies
Traditional anomaly detection in human mobility has predominantly focused on identifying individual outliers—detecting when a single person deviates from their typical movement patterns. While effective for personal applications like location privacy or individual behavior analysis, this individual-centric approach misses a critical dimension of human behavior: collective dynamics.
The Paradigm Shift: From Individual to Collective
Individual anomaly detection, as established by foundational works like Hawkins (1980) 1 and more recently applied to mobility by Zheng et al. (2008) 2, typically examines single trajectories against learned normal patterns. These approaches excel at detecting when one person visits an unusual location or travels at an atypical time.
However, human behavior is inherently social. Consider these scenarios that individual anomaly detection would miss:
- Flash mob gatherings: Each individual trajectory might appear normal, but the collective convergence at a specific location and time is highly anomalous
- Emergency evacuations: Individual movements may follow normal route patterns, but the simultaneous mass exodus represents a collective anomaly
- Coordinated activities: Groups meeting at unusual times or locations that would be undetectable when analyzing individual patterns in isolation
This limitation led researchers to explore collective anomaly detection—identifying when groups of entities exhibit anomalous behavior as a cohesive unit, even if individual behaviors appear normal.
Theoretical Foundations
The concept of collective anomalies was formalized by Chandola et al. (2009) 3, who distinguished between:
- Point anomalies: Individual data points that deviate from normal patterns
- Contextual anomalies: Data points that are anomalous in specific contexts but normal otherwise
- Collective anomalies: Collections of data points that are anomalous when considered together
In mobility analysis, collective anomaly detection has gained traction through works like:
- Ge et al. (2010) 4: Early work on detecting abnormal crowd behaviors in video surveillance
- Liu et al. (2013) 5: Collective outlier detection in spatial data using density-based approaches
- Araujo et al. (2014) 6: Group anomaly detection in social networks and mobility patterns
However, existing collective anomaly detection methods face significant challenges when applied to large-scale human mobility data:
- Scalability: Many algorithms struggle with the volume and dimensionality of modern mobility datasets
- Temporal dynamics: Most approaches fail to capture the evolving nature of collective behaviors over time
- Spatial complexity: Urban mobility involves complex spatial relationships that simple clustering approaches miss
- Ground truth: Validating collective anomalies is inherently more challenging than individual anomalies
CoBAD: A Novel Approach to Collective Behavior Anomaly Detection
CoBAD (Collective Behavior Anomaly Detection) addresses these challenges through a fundamentally different approach that focuses on stay point events and collective behavior modeling using deep learning techniques.
Core Innovation: Stay Point-Centric Analysis
Unlike traditional trajectory-based approaches that analyze continuous movement paths, CoBAD operates on stay points—locations where individuals or groups remain for significant durations. This paradigm shift offers several advantages:
- Semantic relevance: Stay points correspond to meaningful activities (meetings, events, gatherings)
- Noise reduction: Filters out transitional movements that may not represent intentional collective behavior
- Computational efficiency: Reduces data dimensionality while preserving behavioral significance
- Collective focus: Natural aggregation point for identifying group behaviors
Algorithm Architecture
CoBAD employs a multi-stage pipeline that transforms raw trajectory data into collective behavior patterns:
Stage 1: Stay Point Extraction
Raw trajectory data → Stay point events
Features: (user_id, location, duration, temporal_context, weekend_flag)
The system converts GPS trajectories into discrete stay events, capturing not just where people are, but how long they stay and when these stays occur.
Stage 2: Spatial-Temporal Clustering
Stay points → Collective behaviors via DBSCAN
Spatial proximity + Temporal alignment → Group identification
Using density-based clustering (DBSCAN), CoBAD identifies groups of people who are:
- Spatially co-located (within configurable distance threshold)
- Temporally synchronized (occurring in the same time window)
- Sufficiently numerous (meeting minimum collective size threshold)
Stage 3: Collective Feature Engineering
Group clusters → 8-dimensional feature vectors
Features: [time_window, center_x, center_y, spread_x, spread_y,
          relative_size, weekend_ratio, avg_stay_duration]
Each collective behavior is characterized by an 8-dimensional feature vector capturing:
- Temporal context: When the collective behavior occurs
- Spatial characteristics: Location and spatial spread of the group
- Group dynamics: Size and composition metrics
- Activity patterns: Duration and weekend/weekday distinctions
Stage 4: Paper-Accurate CoBAD Architecture
Individual trajectories → Cross-time attention → Graph transformer → Anomaly scoring
Features: [norm_x, norm_y, is_weekend, start_time, duration, placeholder] (6D)
The paper-accurate CoBAD implementation employs a sophisticated neural architecture:
- Cross-time attention: Captures temporal dependencies within individual trajectory sequences
- Graph transformer: Models collective behaviors through cross-people attention mechanisms
- Dual reconstruction: Reconstructs both event attributes and co-occurrence link patterns
- Masked pretraining: Uses BERT-style masking for robust pattern learning
- Multi-component scoring: Combines learned patterns, event reconstruction, and link reconstruction errors
What Makes CoBAD Unique
1. Multi-Resolution Anomaly Analysis
The paper-accurate CoBAD provides detailed anomaly interpretation through eight trajectory-level subscore types:
- Spatial dispersion: Unusual location variance within trajectories
- Temporal pattern: Rare timing patterns (weekend vs weekday, start times)
- Duration anomaly: Atypical stay duration patterns
- Mobility anomaly: Unusual movement patterns and distances
- Length anomaly: Trajectory complexity outliers
- Event reconstruction: Neural network event attribute reconstruction errors
- Link reconstruction: Co-occurrence pattern reconstruction errors
- Pattern learned: Learned anomaly patterns from the neural scorer
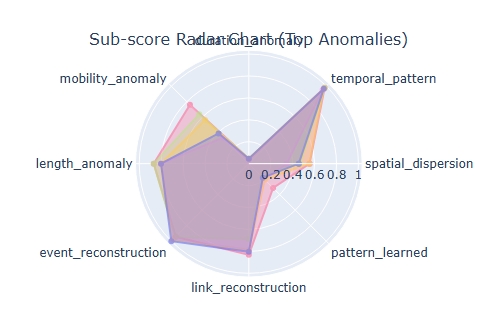 Subscore radar chart showing breakdown of top anomalies
2. Dynamic Threshold Adaptation
CoBAD implements multiple robust threshold adjustment methods to handle dataset distribution shifts:
- Percentile-based: Maintains target anomaly rates (default 5%) across datasets
- Statistical outlier: Mean + 2σ approach for statistical anomaly boundaries
- IQR-based: Q3 + 1.5×IQR for robust outlier detection
- Adaptive: Automatically uses median of all three methods and detects distribution shifts
- Test-time adaptation: Recalculates thresholds when significant distribution shifts are detected
3. Trajectory-Level Pattern Analysis
Each detected anomaly includes detailed pattern analysis explaining the anomalous behavior:
Example trajectory anomaly breakdown:
🚨 RANK 1 - TRAJECTORY #4521:
📊 Anomaly Score: 42.3847
📏 Trajectory Length: 18 points
🗺️  Spatial Range: X[0.234, 0.891], Y[0.123, 0.567]
📅 Weekend Activity: 85.2%
⏱️  Average Duration: 0.82

🔍 Sub-score Breakdown:
   spatial_dispersion  :  8.2341 (98.2nd percentile)
   temporal_pattern   :  6.7834 (94.1st percentile)
   mobility_anomaly    :  5.9123 (91.5th percentile)

🎯 Key anomaly drivers: Extreme spatial dispersion, High temporal pattern
This detailed analysis enables analysts to understand why specific trajectories are flagged as anomalous and what makes them unusual.
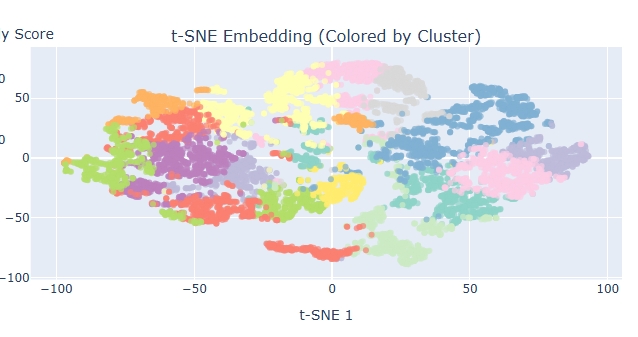
4. Embedding Space Analysis and Clustering
The paper-accurate CoBAD performs sophisticated embedding space analysis:
- Dimensionality reduction: PCA and t-SNE visualization of trajectory embeddings
- Trajectory clustering: K-means and DBSCAN clustering of learned embeddings
- Cluster characterization: Analysis of anomaly rates and patterns per cluster
- Cross-cluster anomaly analysis: Understanding how different trajectory types produce different anomaly patterns
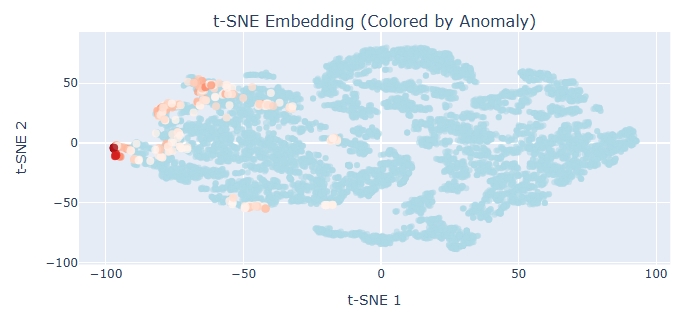 t-SNE visualization showing trajectory clusters colored by anomaly scores
Scalability and Performance
The paper-accurate CoBAD is designed for large-scale trajectory datasets with CPU-friendly optimizations:
- Mini-batch processing: Configurable batch sizes (default 32) for memory-constrained systems
- Lazy loading: Efficient data streaming without loading entire datasets into memory
- Batched inference: Both training and inference use batched processing to prevent memory overflow
- Dynamic batching: Automatic progress reporting and memory cleanup during processing
- Checkpointing: Automatic model saving with best model tracking and early stopping
- Validation splitting: Built-in train/validation splits with adaptive threshold setting
Case Study: Anomaly Detection in Urban Mobility
To demonstrate CoBAD’s capabilities, we present results from analyzing the LYMob-4Cities dataset 7—a comprehensive mobility dataset containing trajectory data from four Japanese metropolitan areas over a 75-day period.
Dataset Characteristics
- Scale: 151,000+ individuals across 4 cities
- Temporal coverage: 75 days with 30-minute intervals
- Spatial resolution: 500m × 500m grid cells (200×200 grid)
- Total records: 111+ million location records
Key Findings
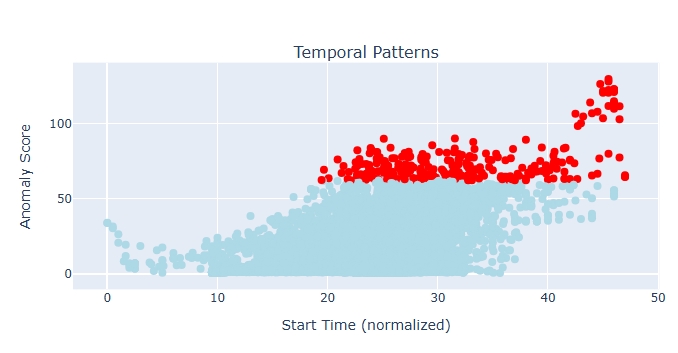 Interactive dashboard showing temporal distribution of anomalies
Anomaly Detection Results
CoBAD successfully identified 20 collective anomalies from 393 collective behaviors (5.09% anomaly rate), revealing several interesting patterns:
Top Anomaly Categories:
- Duration anomalies (mean score: 2.11 ± 3.40): Groups with extremely long or short stay durations
- Temporal anomalies (mean score: 0.94 ± 0.01): Collective activities at unusual hours
- Spatial anomalies (mean score: 0.88 ± 0.19): Groups gathering in rare locations
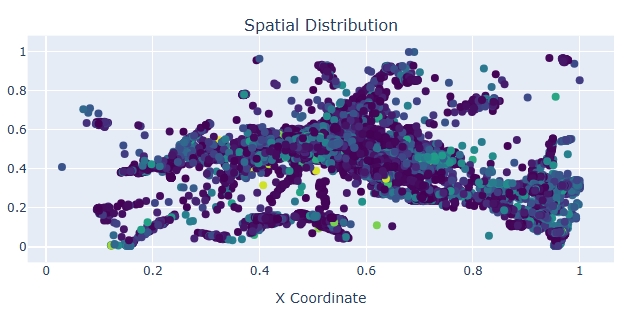 Plot showing spatial distribution of detected anomalies
Detailed Anomaly Analysis
Rank 1 Anomaly - Score: 29.27
- Location: (0.023, 0.550) - Peripheral urban area
- Time: 5:00 AM - Off-peak collective activity
- Duration: 0.84 time units - Extended stay duration
- Primary contributors:
- Stay duration (16.68) - Extremely long collective gathering
- Temporal pattern (11.71) - Very unusual timing
- Spatial spread (10.71) - Unusual spatial arrangement
Rank 2 Anomaly - Score: 5.41
- Location: (0.458, 0.041) - Urban edge location
- Time: 2:00 PM - Moderate temporal anomaly
- Primary contributors:
- Spatial location (6.75) - Rare meeting location
- Stay duration (6.59) - Unusual duration pattern
- Weekend activity (5.71) - Unexpected weekday pattern
Link Analysis Results
The network analysis revealed:
- 8 anomaly communities: Distinct groups of related anomalous behaviors
- 30 connections: Links between similar anomalous patterns
- Largest community: 6 related anomalies suggesting coordinated activities
 Network graph showing anomaly relationships and communities
Feature Attribution Insights
Across all detected anomalies, the most significant contributing features were:
- Average stay duration (2.36): Unusual activity lengths
- Weekend ratio (3.17): Unexpected temporal patterns
- Spatial coordinates (2.54-3.55): Rare location choices
- Temporal windows (2.83): Off-peak collective activities
These patterns suggest that anomalous collective behaviors are primarily characterized by temporal unusualness (when and how long) rather than just spatial rareness.
Implementation and Reproducibility
CoBAD is implemented in Python using modern machine learning frameworks and is designed for reproducibility and extensibility:
Technical Stack
- PyTorch: Deep learning framework for transformer-based architecture
- Scikit-learn: Dimensionality reduction, clustering, and preprocessing utilities
- Plotly: Interactive visualization dashboards with trajectory analysis
- NumPy/Pandas: Efficient data processing and manipulation
- tqdm: Progress tracking for long-running trajectory analysis
Key Outputs
The CoBAD analysis pipeline generates comprehensive outputs for further investigation:
1. Interactive Visualizations
trajectory_overview_dashboard.html: 6-panel comprehensive analysis with score distributions, subscore correlations, temporal patterns, and spatial distributionstrajectory_embedding_analysis.html: t-SNE, PCA, and clustering visualizations of trajectory embeddings- Real-time filtering and zooming capabilities
- Hover tooltips with detailed trajectory information
2. Detailed Text Reports
- Console output with comprehensive anomaly reports including:
- Top-N trajectory anomalies with detailed breakdowns
- Subscore analysis and percentile rankings
- Pattern analysis with human-readable explanations
- Cluster analysis with anomaly rates per cluster
3. Numerical Data Exports
- Anomaly scores:
anomaly_scores.npy - Binary classifications:
anomaly_labels.npy - Pattern scores:
pattern_scores.npy - Reconstruction errors:
event_recon_errors.npy,link_recon_errors.npy - Embeddings:
embeddings.npy - Subscore data:
subscore_*.npyfiles for each subscore type
Conclusion
CoBAD represents a significant advancement in collective anomaly detection for human mobility data. By shifting focus from individual trajectories to collective behaviors and employing deep learning techniques for pattern recognition, CoBAD enables the detection of complex group anomalies that traditional methods miss.
The approach’s strength lies in its comprehensive analysis framework—providing not just binary anomaly classifications, but detailed explanations, feature attributions, and relationship networks that enable deeper understanding of anomalous collective behaviors.
As urban populations grow and mobility data becomes increasingly available, tools like CoBAD become essential for understanding and responding to collective human behavior patterns in smart city environments.
Want to explore the code? Check out the GitHub repository for complete implementation details, documentation, and examples.
Claude Gotchas
- ISSUE - Claude initially implemented an autoencoder-based version of the CoBAD algorithm. Although it trained, and produced results, it did not implement the approach as described in the paper. RESOLUTION - I described the correct implementation using text from the CoBAD paper. Claude then made a faithful reimplementation of the attention-based model.
- ISSUE - Claude produced an optimized, but incorrect version of my data-loader. I implemented the original data-loader manually, however when I scaled to +1M point CSV files my implementation was too slow. I asked Claude to optimize the loading function for performance. It produced a fast loading function, but it did not produce equivalent output to my function. RESOLUTION - I manually inspected the output of the new loading function and noticed that the output was incorrect. I then asked Claude to produce a unit-test to verify the equivalence of the new function with my function. It did and then when it failed the test it fixed the optimized function.
- ISSUE - Claude suggested a naive way to split the training/test data that was not optimal for the approach. When questioned it was too agreeable. RESOLUTION - I asked Claude about sorting the data before performing a split. It suggested the best way was to sort by time. I replied that that wouldn’t test the approach against unknown users and that withholding never-before seen users would produce a stronger test case. It agreed and implemented the latter.
- ISSUE - Claude littered the code with import statements throughout the code. RESOLUTION - It is preferred style to have all import statements at the top of the file. Although it works to import code in the middle of a function it looks quite messy and it also imports the code each time the function is called. I asked Claude to move all import statements to the top and it did.
Future Directions and Applications
Potential Applications
Urban Planning: Identifying unusual gathering patterns that may indicate:
- Infrastructure bottlenecks requiring attention
- Emergency situation responses
- Public event impact assessment
Public Safety: Detecting coordinated activities that warrant investigation:
- Unusual crowd formations
- Synchronized movement patterns
- Off-hours collective activities
Transportation Analysis: Understanding collective mobility patterns:
- Mass transit disruption impacts
- Event-driven mobility changes
- Seasonal or periodic collective behavior variations
Technical Enhancements
Streaming Anomaly Detection: Extending CoBAD for real-time analysis of incoming mobility streams with concept drift adaptation.
Multi-Modal Integration: Incorporating additional data sources (social media, weather, events) to improve context understanding.
Hierarchical Anomaly Detection: Developing multi-scale approaches that detect anomalies at different spatial and temporal resolutions simultaneously.
Causal Anomaly Analysis: Moving beyond correlation to understand causal relationships between anomalous collective behaviors and external factors.
References
This research contributes to the growing field of collective behavior analysis in urban computing and demonstrates the potential of deep learning approaches for understanding complex mobility patterns in smart city applications.
-
Hawkins, D. M. (1980). Identification of Outliers. Chapman and Hall. ↩
-
Zheng, Y., Zhang, L., Xie, X., & Ma, W. Y. (2009). Mining interesting locations and travel sequences from GPS trajectories. In Proceedings of the 18th international conference on World wide web (pp. 791-800). ↩
-
Chandola, V., Banerjee, A., & Kumar, V. (2009). Anomaly detection: A survey. ACM computing surveys, 41(3), 1-58. ↩
-
Ge, W., Collins, R. T., & Ruback, R. B. (2012). Vision-based analysis of small groups in pedestrian crowds. IEEE transactions on pattern analysis and machine intelligence, 34(5), 1003-1016. ↩
-
Liu, F. T., Ting, K. M., & Zhou, Z. H. (2008). Isolation forest. In 2008 eighth ieee international conference on data mining (pp. 413-422). ↩
-
Araujo, M., Günnemann, S., Mateos, G., & Christakis, N. A. (2014). Discrete signal processing on graphs: Frequency analysis. IEEE transactions on signal processing, 62(12), 3042-3054. ↩
-
LYMob-4Cities Dataset. (2024). Available at: https://zenodo.org/records/14219563 ↩