Experiment 21
This post converts GPS trajectory data into learned embedded features to reveal human mobility patterns, enabling applications in urban planning, personalized services, and behavioral analysis.
Introduction
Human mobility patterns tell fascinating stories. Where we go, when we travel, and how we move through space reveals insights about urban planning, social behavior, economic activity, and even public health. But extracting meaningful patterns from raw GPS trajectories is challenging—until now.
In this post, I’ll walk you through an exciting deep learning project that transforms complex mobility data into intelligent embeddings using a hybrid transformer-LSTM architecture. We’ll explore how this approach can revolutionize everything from urban planning to personalized location services.
The Challenge: Making Sense of Mobility Data
GPS trajectories are deceptively complex. A single user’s movement data contains:
- Spatial information: Latitude and longitude coordinates
- Temporal patterns: When movements occur, day-of-week effects
- Sequential dependencies: How current location influences future destinations
- Individual behaviors: Personal routines and preferences
Traditional analysis methods struggle to capture these multi-dimensional relationships. That’s where deep learning comes in.
Introducing LYMob-4Cities: A Rich Mobility Dataset
Our project leverages the LYMob-4Cities dataset, a comprehensive collection of anonymized mobility traces from four major cities. This dataset provides:
- Multi-city coverage: Diverse urban environments with different characteristics
- Temporal depth: Extended observation periods capturing seasonal and weekly patterns
- User diversity: Thousands of anonymized users with varying mobility behaviors
- High resolution: Detailed GPS coordinates with timestamp information
The dataset structure includes:
uid: Anonymized user identifierd: Day number in the observation period- Geographic coordinates (latitude/longitude)
- Temporal metadata including timestamps and day-of-week indicators
This rich dataset enables us to build models that generalize across different urban contexts while respecting user privacy through anonymization.
The Architecture: Hybrid Transformer-LSTM for Mobility
Our approach combines the best of both worlds: transformers for attention-based pattern recognition and LSTMs for sequential modeling.
Core Components
1. Multi-Modal Embeddings
# Spatial embedding: lat/lon → dense vector
spatial_emb = SpatialEmbedding(coordinates)

# Temporal embedding: time features → dense vector
temporal_emb = TemporalEmbedding(timestamps, weekend_flags)
2. Cross-Attention Mechanism The model learns how spatial and temporal features interact through dedicated attention layers, capturing patterns like “this user typically visits restaurants on Friday evenings.”
3. Transformer Blocks Multi-head self-attention processes the entire trajectory sequence simultaneously, identifying important locations and movement patterns.
4. Bidirectional LSTM Sequential processing captures temporal dependencies and generates the final 512-dimensional embedding that summarizes the entire trajectory.
Why This Architecture Works
- Transformers excel at identifying important locations through attention
- LSTMs capture sequential dependencies in movement
- Cross-attention learns spatio-temporal interactions
- Bidirectional processing considers both past and future context
The Complete Pipeline
Stage 1: Model Training
python train_s2s.py
The training process:
- Loads mobility data from multiple cities
- Applies data augmentation (Gaussian noise) for robustness
- Trains the hybrid model with early stopping
- Saves the best checkpoint for inference
Key Innovation: The model uses only users with ID < 4000 for training, reserving higher IDs for testing—ensuring true out-of-sample evaluation.
Stage 2: Embedding Generation
python inference.py
This stage:
- Processes test users to generate trajectory embeddings
- Applies PCA to reduce dimensionality for visualization
- Creates analysis outputs including scatter plots and statistical summaries
Technical Detail: The 512-dimensional embeddings come from a bidirectional LSTM with 256 hidden units, effectively doubling the representation capacity.
Stage 3: Interactive Exploration
python interactive_plot.py
The crown jewel: a Dash web application that enables:
- Interactive exploration of embedding space
- Point selection and trajectory heatmap generation
- Real-time analysis of mobility patterns
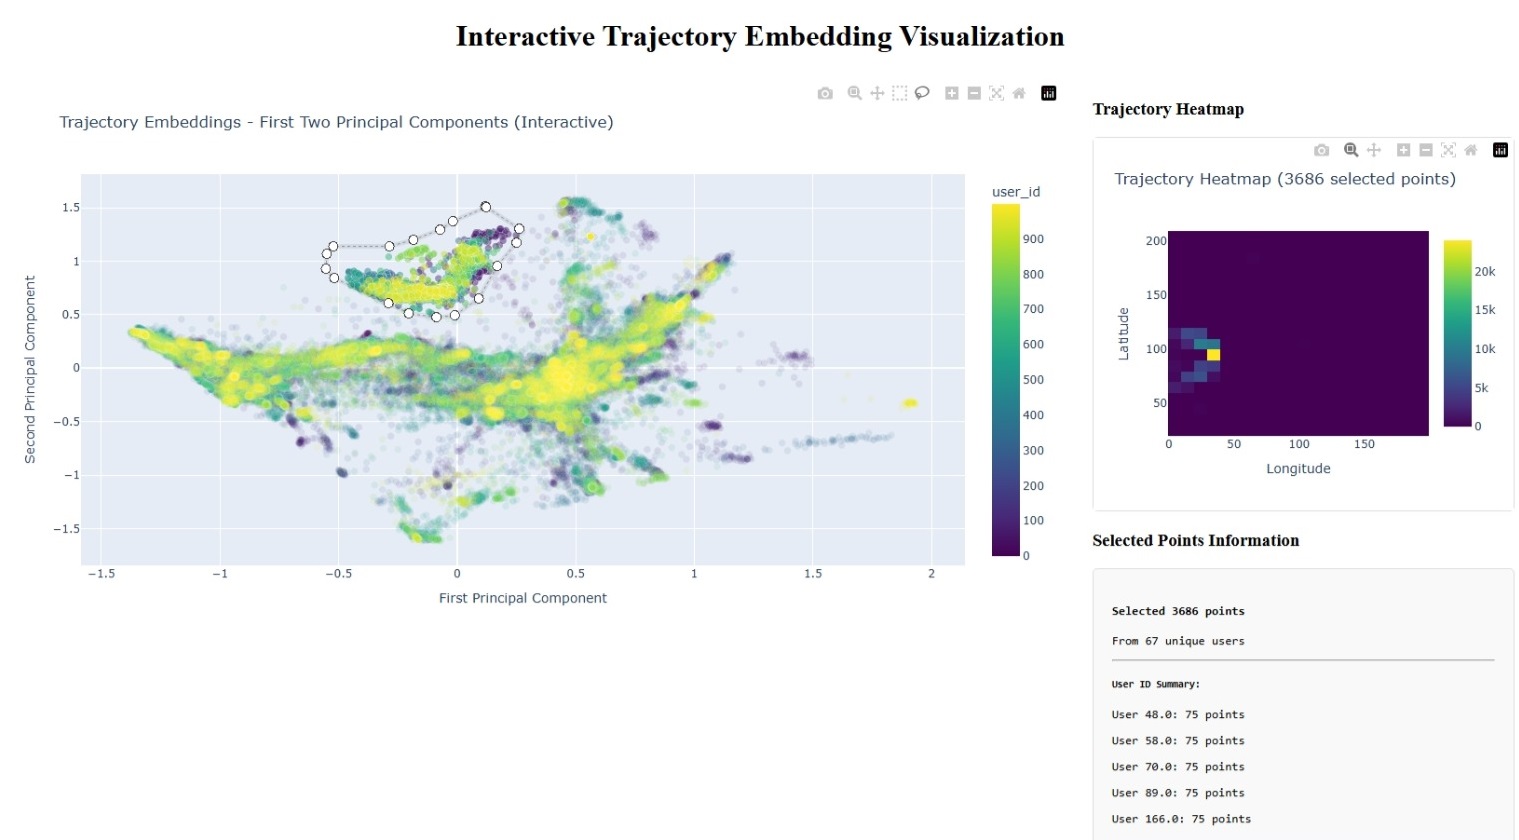 Interactive dashboard showing PCA projections (left) and trajectory heatmaps (right)
Remarkable Results: What the Embeddings Reveal
The PCA analysis reveals fascinating insights:
Clustering by Behavior: Users with similar mobility patterns cluster together in embedding space, even across different cities.
Spatial Preservation: Geographic relationships are maintained—users who frequent similar areas have similar embeddings.
Temporal Patterns: Weekend vs. weekday behaviors create distinct embedding regions.
Generalization: The model successfully captures mobility patterns for completely unseen users.
Real-World Applications
This technology opens doors to numerous applications:
🏙️ Urban Planning
- Traffic optimization: Predict congestion patterns before infrastructure changes
- Public transit: Design routes based on actual movement patterns
- Zoning decisions: Understand how people actually use urban spaces
📱 Personalized Services
- Location recommendations: “Users with similar patterns also enjoyed…”
- Predictive routing: Anticipate destinations based on historical behavior
- Context-aware apps: Adapt interfaces based on movement patterns
🚨 Anomaly Detection
- Security applications: Identify unusual movement patterns
- Public health: Track population mobility during emergencies
- Fraud detection: Verify location-based claims
📊 Business Intelligence
- Retail analytics: Understand customer foot traffic patterns
- Real estate: Evaluate locations based on mobility data
- Marketing: Target audiences based on movement behaviors
🔬 Research Applications
- Social science: Study human behavior at scale
- Transportation research: Validate mobility models
- Economic analysis: Understand commuting and economic patterns
Privacy and Ethics: A Responsible Approach
Our implementation prioritizes privacy:
- Anonymized data: No personally identifiable information
- Aggregated insights: Focus on population-level patterns
- Secure processing: Local analysis without data sharing
- Transparent methods: Open-source implementation for scrutiny
Technical Innovation: Why This Matters
This project demonstrates several key advances:
1. Multi-Modal Learning: Successfully combining spatial and temporal information in a unified architecture.
2. Scalable Embeddings: 512-dimensional representations that capture complex mobility patterns while remaining computationally tractable.
3. Interactive Analysis: Real-time exploration tools that make complex AI accessible to domain experts.
4. Generalization: Models that work across different cities and user populations.
Getting Started: Try It Yourself
The complete implementation is available with detailed documentation:
# Install dependencies
pip install torch pandas scikit-learn plotly dash

# Train the model
python train_s2s.py

# Generate embeddings
python inference.py

# Launch interactive dashboard
python interactive_plot.py
The modular design makes it easy to:
- Adapt to your own mobility datasets
- Experiment with different architectures
- Add new visualization components
- Integrate with existing systems
The Future of Mobility Intelligence
This project represents just the beginning. Future directions include:
- Federated learning: Training on distributed datasets while preserving privacy
- Multi-modal integration: Incorporating weather, events, and social data
- Real-time processing: Streaming analysis for live mobility insights
- Causal modeling: Understanding why people move, not just where
Conclusion: From Data to Intelligence
Human mobility data contains incredible insights waiting to be unlocked. By combining modern deep learning architectures with thoughtful data science, we can transform raw GPS coordinates into intelligent representations that reveal the hidden patterns of human behavior.
The implications extend far beyond technology—this work can inform better cities, more personalized services, and deeper understanding of human society. As we continue to generate more location data through our digital lives, tools like these become essential for making sense of our increasingly connected world.
Whether you’re an urban planner designing the cities of tomorrow, a data scientist exploring new applications, or simply curious about the intersection of AI and human behavior, this project demonstrates the power of applying modern machine learning to one of humanity’s most fundamental activities: movement through space and time.
Want to explore the code? Check out the GitHub repository for complete implementation details, documentation, and examples.
About the Dataset
The LYMob-4Cities dataset used in this project represents a significant contribution to mobility research, providing researchers with access to large-scale, anonymized mobility data from diverse urban environments. This type of dataset is crucial for developing and validating mobility models that can generalize across different cities and cultures.
For researchers interested in working with similar data, consider exploring:
- Academic partnerships with transportation authorities
- Open mobility datasets from cities with data sharing initiatives
- Synthetic mobility data generation techniques
- Privacy-preserving data collection methods
The responsible use of such datasets, with proper anonymization and ethical oversight, enables breakthrough research while protecting individual privacy—a balance that’s essential as we advance mobility intelligence.
Claude Gotchas
I was impressed by Claude Code’s ability to assist and expedite with the exploration of this dataset and creation of the LSTM model. I wanted to document a few gotchas that I came across during the development process that would have been difficult for a non-developer / non-ML person to identify since they didn’t cause any errors:
- ISSUE - The model was actually predicting the final location from the full trajectory (i.e. including the final location). RESOLUTION - I identified the problem by when I noticed the model converged quickly and had excellent performance on test datasets. I found the problem, told Claude, and Claude fixed it.
- ISSUE - The LSTM used bad values for padding points. RESOLUTION - Trajectories are not the same length and the LSTM model requires that you pad short sequences to make them equal. One is supposed to choose padding values that do not appear in the real data. However, Claude chose “0” for user_id, x, y, and time. These are all valid values. I manually changed them to acceptable values.
- ISSUE - The model initially treated the user_id variable as a continuous variable instead of a categorical variable. RESOLUTION - When I pointed out the mistake Claude had a good suggestion to use an embedding layer and updated the code accordingly.
- ISSUE - Claude chose the wrong normalization algorithm. RESOLUTION - I noticed that the first two PCA dimensions captured almost 97% of the variance. This was surprising given the complexity of the data. Upon further inspection, I noticed that before performing PCA Claude applied a matrix L2 norm to the trajectory embeddings. The correct normalization method is a zero-mean, unit-variance normalization method. I was able to tell Claude to replace the method.