Dashboards
lex-align-server ships four dashboards. They render server-side from templates baked into the Python package and call the read-only JSON API for their data, so they work against any deployment without needing a separate frontend build.
| Path | Audience | Goal |
|---|---|---|
/dashboard/registry | Platform / dev experience | Triage approval requests, edit the registry, export YAML. |
/dashboard/legal | Legal / OSS compliance | License-compliance posture across all evaluations. |
/dashboard/security | AppSec / supply-chain | Vulnerability posture across all evaluations. |
/dashboard/agents | Operators | Which agent identities are doing what. |
Every page accepts a ?project=… filter scoped to the X-LexAlign-Project value clients send.
Registry workshop — /dashboard/registry
The interactive page. It loads the live registry, surfaces what's waiting to be triaged, and routes any change through the configured proposer so the YAML on disk stays the source of truth. For most installs that's the local_file proposer — the click writes registry.yml and the file watcher reloads. The advanced PR-based flow is opt-in.
Key pieces:
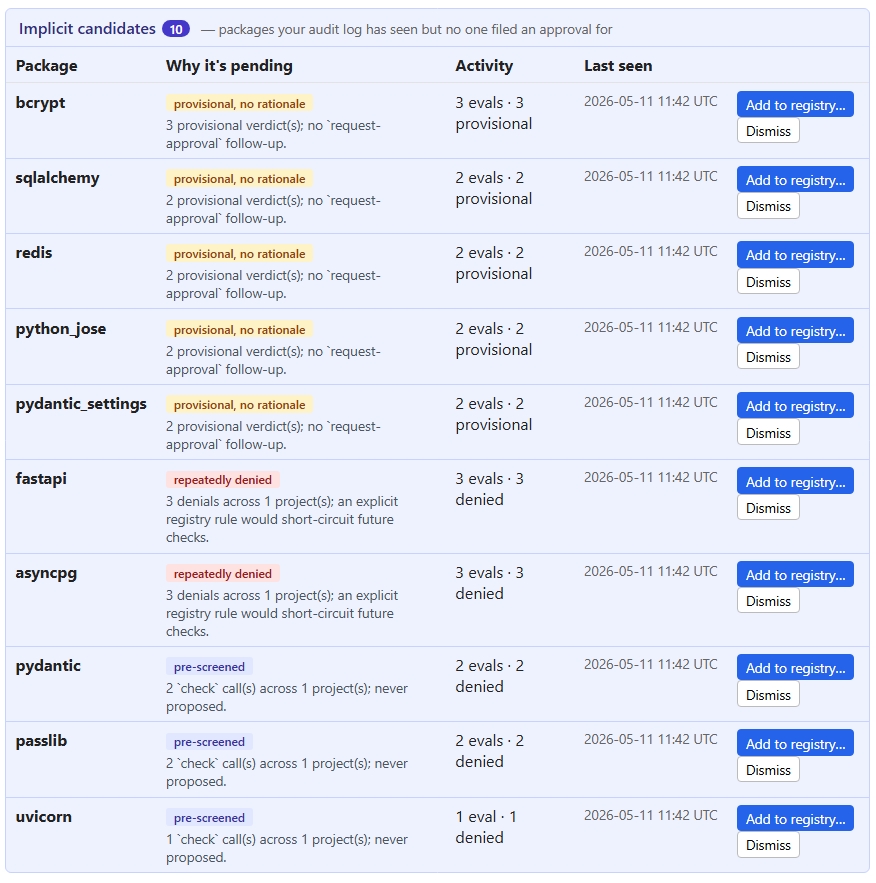
- Pending approval requests — packages someone explicitly filed a
request-approvalfor. - Implicit candidates — packages the audit log has seen but no one filed an approval for, classified by why they're surfacing (
provisional-no-rationale,repeatedly-denied,pre-screened). - Global policies editor — CVSS threshold, auto-approve / hard-ban license lists, unknown-license policy.
- Add to registry… — opens the proposer flow (direct write for
local_file, commit forlocal_git, PR for the opt-ingithubbackend). - Export YAML — last-resort manual save. Useful when running with
log_only.
Legal compliance — /dashboard/legal
The legal dashboard answers "what licenses are in our supply chain, and how is the policy classifying them?" It's framed for whoever owns OSS-licensing risk; the policy itself lives in the registry workshop.
It pulls from /api/v1/reports/legal, which returns:
| Field | What it shows |
|---|---|
total_denials | Count of DENIED audit rows whose denial category is license. |
recent | The 100 most recent license-driven denials. |
license_breakdown | Every audit row in scope grouped by normalised license, split into allowed / provisional / denied. |
unknown_license | The same shape, restricted to rows that normalised to UNKNOWN. |
top_projects | Projects ranked by number of license-driven denials. |
Page sections:
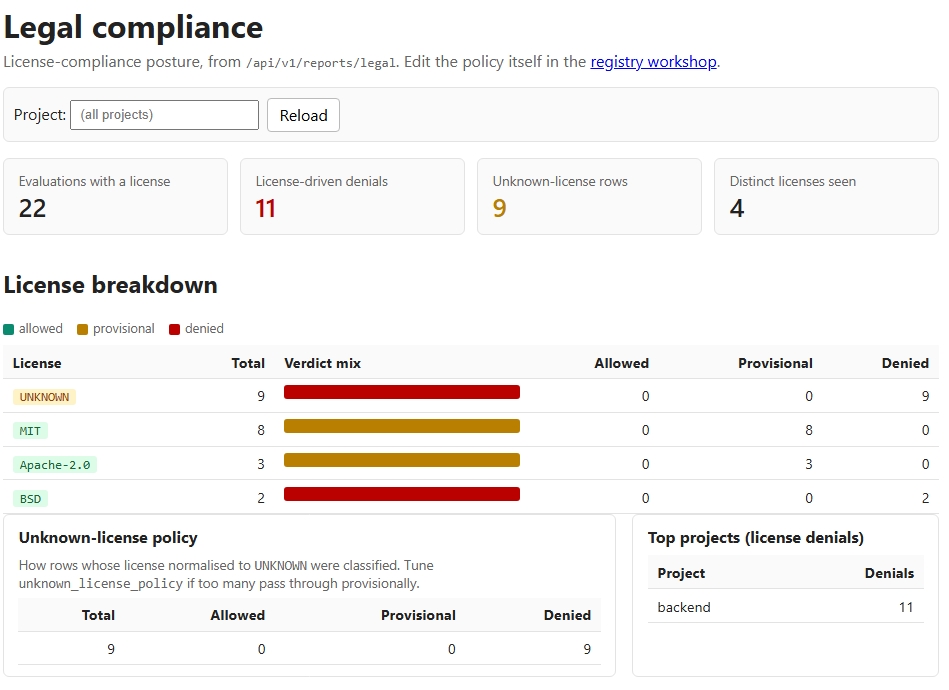
- KPI strip — total evaluations with a license, license-driven denials, unknown-license rows, and the count of distinct licenses ever seen.
- License breakdown table — every license sorted by frequency, with a stacked bar showing the verdict mix at a glance. Copyleft licenses (GPL, AGPL, LGPL) get a red tag; permissive ones (MIT, BSD, Apache, ISC) get a green tag;
UNKNOWNgets an amber tag. - Unknown-license policy panel — how the configured
unknown_license_policyis performing in production. If you're seeing a lot of provisional rows that never get followed up on, that's a signal the policy is too lax. - Top projects — which repos are pulling the most non-compliant packages.
- Recent denials — the existing 100-row tail with project, package, license, reason, and the agent identity that triggered it.
Reading the breakdown
- A copyleft row that's mostly
deniedis the policy doing its job — investigate only if the count is climbing. - A copyleft row with
allowedrows means it slipped past the policy. Most often that's because the license isn't onhard_ban_licensesand the package matched a registrypreferred/approvedrule. Either ban the license globally or downgrade the package's registry status. - High
UNKNOWNcount withprovisionalverdicts means PyPI metadata isn't giving us a normalisable license string for those packages. Either chase upstream metadata or tightenunknown_license_policyfrompending_approvaltoblock.
Security posture — /dashboard/security
The security dashboard answers "are we letting known vulnerabilities into the codebase, and are any already-approved packages turning hot?" It pulls from /api/v1/reports/security, which extends the base denial report with:
| Field | What it shows |
|---|---|
total_denials | Count of DENIED audit rows whose denial category is cve. |
recent | The 100 most recent CVE-driven denials. |
severity_distribution | CVE-denied rows bucketed by max CVSS (critical ≥ 9.0, high ≥ 7.0, medium ≥ 4.0, low > 0, unknown). |
top_packages | Packages with the most CVE-driven denials, carrying their highest-seen CVSS and up to five CVE ids. |
top_cves | The CVE identifiers showing up most often. |
hot_registry_packages | Registry-allowed packages whose audit rows in the last 30 days include a CVE-driven denial or provisional. |
cve_alerts | Most recent CVE_ALERT rows written by the background re-scan scheduler. One per (package, scan tick) where the registered package's max CVSS now crosses the configured threshold. |
Page sections:
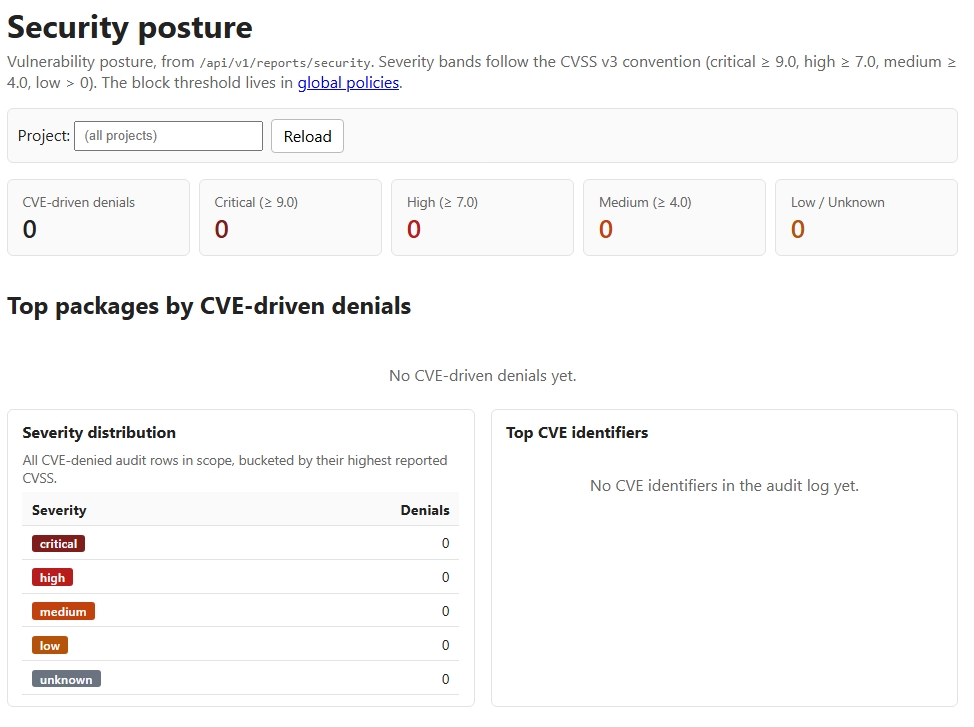
- KPI strip — total CVE denials and per-severity counts, sized so a spike in critical is impossible to miss.
- "Already-approved packages with new CVE activity" — the highest-signal cell. Anything in the registry as
preferred,approved, orversion-constrainedwhose audit rows in the last 30 days went through a CVE denial or provisional verdict shows up here. This is exactly the case thepre-commithook in CLAUDE.md is documented to catch — except the dashboard finds it before someone tries to commit. - Top packages by CVE denials — sorted by max CVSS first, then by denial count, with their CVE ids inline.
- Severity distribution panel — a simple counts-by-bucket table.
- Top CVE identifiers panel — which CVE ids drive the most blocks, and which packages they hit.
- Recent CVE denials — the chronological tail.
Background CVE re-scan
The dashboard's "hot packages" panel reacts to /evaluate traffic — a package only surfaces there if someone has actually checked it recently. To catch the case where a critical CVE drops on an already-approved package that nobody is currently checking, the server runs an asyncio scheduler in-process that walks every package in the live registry on a fixed cadence and re-queries OSV.
- Cadence is set by
LEXALIGN_CVE_SCAN_INTERVAL_HOURS(default24,0disables the scheduler entirely). - For each registered package whose max CVSS now crosses
global_policies.cve_threshold, the scanner writes aCVE_ALERTrow to the audit log with the package name, CVE ids, max CVSS, and current registry status. - The scanner is alert-only. It never auto-flips a package to
bannedor otherwise mutates the registry — the policy decision stays with the operator, so green builds don't break overnight. - Alerts surface as the
cve_alertsfield of/api/v1/reports/security(and therefore in the security dashboard) and in thelex-align-client statussummary, with no other endpoint changes.
The scheduler shares OSV's response cache with the on-demand /evaluate path, so a scan tick warms the cache for everyone else. With the default 24h cadence and 6h cache TTL, every alert is at most a scan-cycle behind the OSV publish.
Acting on a "hot" registry package
When something appears in already-approved packages with new CVE activity (or as a CVE_ALERT from the background scanner):
- Check the CVE ids and the affected version range in OSV.
- If you're on a safe version, pin it: open the registry workshop, set the package to
version-constrainedwith amin_version, and propose the change. - If no safe version exists yet, set it to
banned(with areasonpointing at the CVE id) until upstream ships a fix. - Either path goes through the same proposer flow as everything else in the registry workshop, so the rationale is captured in the audit trail.
Agent activity — /dashboard/agents
A simple read-only roll-up of /api/v1/reports/agents. Groups every audit row by (agent_model, agent_version) so operators can answer "which Claude version made that request?". The X-LexAlign-Agent-Model and X-LexAlign-Agent-Version headers the client sends propagate into every audit row; rows without them collapse into a single unknown bucket.
Direct API access
Every dashboard is a thin renderer over the JSON API; you can hit the endpoints directly with curl for scripting:
curl -s http://localhost:8000/api/v1/reports/legal | jq .
curl -s http://localhost:8000/api/v1/reports/security?project=demo | jq .
curl -s http://localhost:8000/api/v1/reports/agents | jq .
The schema additions on the legal and security endpoints are additive; older clients that only consumed total_denials and recent keep working.